
Risk Analytics for Credit Teams
Every position, P&L and VaR figure, in one real-time view.

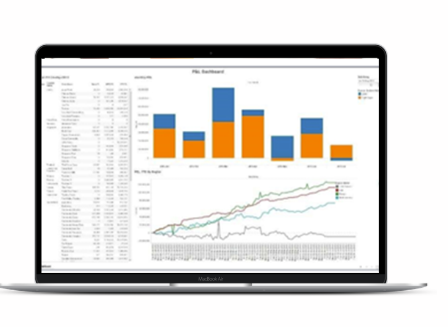
Manage valuation, P&L, VaR and risk sensitivities on one platform, with clear visibility of positions, profitability and price risk, including correlations. See the impact of new and potential trades on limits and exposure in real time, run stress tests from trade leg to portfolio, and drill into the drivers of VaR and P&L. Fast to deploy, without a long implementation project.
Benefits
Why trading firms choose CubeCalc
- Fast to deploy. Immediate business benefits, without an expensive, drawn-out implementation.
- One consolidated view. Positions, P&L and risk from every trading system, in one place.
- Slice and dice in real time. Analyse by trade leg, portfolio hierarchy or any aggregation you need.
- Know your drivers. Decompose VaR and P&L to see exactly where risk and profit come from.
- Your models or ours. Use our valuation models or connect your own through the API.
Valuation
CubeCalc SV is an inhouse valuation engine with modular components for curve construction and valuation models. This is designed to be either standalone, or modular to integrate with and enhance any business.
- Curve construction with interpolation, extrapolation and bootstrapping models. Full clean curves can also be provided as desired.
- Curve mappings including aliasing, proxying, index functions.
- Internal valuation models for a variety of trade types. Focussed on commodity and energy trade types including physicals. This includes conversions into different currencies from merging FX and futures curves.
- External valuation API for models which the client prefers to retain control, or models that require more complexity than currently covered. The inhouse engine can submit through both stress and non-stress versions of information required and use an external valuation engine to provide this response.
- Valuation provides uncollateralised Notional, MTM, Accrual, ARAP for valuation date that is processed i.e. current exposure (Future value and present value). Accrual and ARAP will calculate accurately for mid delivery contracts. This can be used as the source for credit processing.
- Calculation of closed form greeks for option trade types.
Stress Testing (Market and Credit)
Market Risk Stress Test
Riskcubed has a custom UI for creation of stress scenarios. This is supplemented with an API for use as desired. The Stress test definition is designed for flexibility and ease of setup and maintenance. Curves can be grouped to allow shock profiles to be applied across a range of curves or groups. Shocks can be defined with start and end dates. These dates can either be relative to the valuation date or can be specified dates. All shock types can also be % or absolute.
Once scenarios are defined the stress scenarios are calculated each time a new valuation is received to provide up to date information.
CCSV provides uncollateralised Notional, MTM, Accrual, ARAP for current exposure (Future value and present value). This can in turn be used as the input to the Credit risk stress test loader and processing.
Credit risk stress test
This can either be fed by the output from market risk stress test or can be populated by an external system. This will be absorbed at a trade leg level and will then run through the walkforward and collateral allocation process using TREE (The Rapid Exposure Engine). Once processed by TREE these output results are loaded into the Credit Cube within their own partition.
Value at Risk (VaR) simulation engine
Parametric VaR simulation provides greater clarity of diversification benefit and correlation risks throughout a portfolio. It has a flexible hierarchy definition to allow both absolute VaR at the appropriate levels as well as meaningful decomposition. CCVR will aggregate calculations across all trades to achieve a single VaR figure and jointly model multiple commodities to observe correlations between price changes.
The risk framework enables:
- Delta normal Parametric VaR model.
- Exponential weighted moving average for historical prices
- Flexible definition of multiple hierarchies.
- Decomposition through hierarchies providing absolute, incremental, marginal, enterprise component and parent component VaR decompositions for intuitive analysis of diversification benefit.
- Full visibility into the correlation matrix for sanity checking and analysis.
- Calibration capabilities to customise calculations, e.g. by adjusting exponential weighting of historical dates, or correlations.
Position and Loss (P&L)
Aggregates transactions from multiple sources to provide a consolidated on-the-fly position and risk management tool across multiple commodities enabling users to:
- Report positions in any unit of measure across portfolio, book, commodity, market and other metrics.
- Track live positions against historical positions, showing historical trends and deltas.
Advanced PnL aggregation and reporting capability including:
- Monitoring daily PnL against desk, trader, country, portfolio, commodity, book, market and other metrics.
- Track historical PnL for WTD, MTD, YTD and LTD calculations.
- Work in multiple currencies.
- Show intra-day “dirty” PnL against live open positions.
- Track historical and forward price curves.
Flexible reporting and tracking of market risk metrics alongside position and PnL measures. The module enables:
- Reporting of Greeks across various metrics such as book, portfolio, desk, commodity.
- Reporting of VaR at book, desk and portfolio level.
- Historical tracking and time trend analysis.
Download factsheets
Learn more about how CubeCalc delivers immediate business benefits